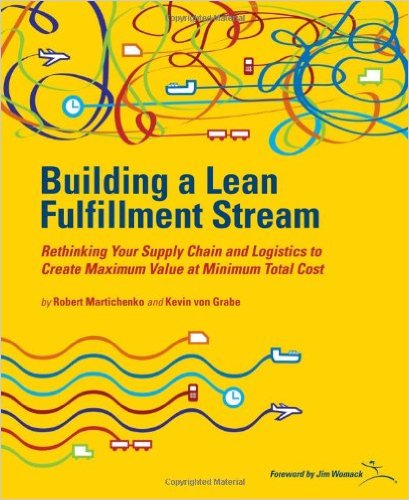
Hot off the press from the Lean Enterprise Institute …
Page 12 & 13 have a brief description of Coefficient of Variation and a SKU Scatter Diagram (weekly volume vs. SKU stability). 10 weeks usually isn’t sufficient for meaningful or statistically significant calculation of standard deviation. 25 data points would be better, and you might need a lot more if there’s any seasonality to deal with.
The guidelines given need to be tempered with the granularity of the data. While a coefficient of variation of less than 1.0 can be considered stable for weekly data, it would be considered very noisy when using monthly data and quite stable when using daily demand.
This small quibble aside the authors Martichenko and von Grabe do a wonderful job describing lean principles for the supply chain, or as they prefer, the fulfillment stream.
