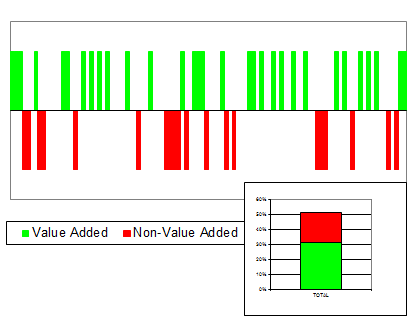
- Determine Total Cycle Time
- Determine Queue Times between steps
- Create Step segments proportional to the task times
- Place steps, queue’s along the line segment in the order that they happen
> Place Value Adding steps above the line
> Place Non-value Adding steps below the line - Draw in feedback loops & label Yield percentages
- Sum Activity / Non-activity times
- Sum Value / Non-value Times

