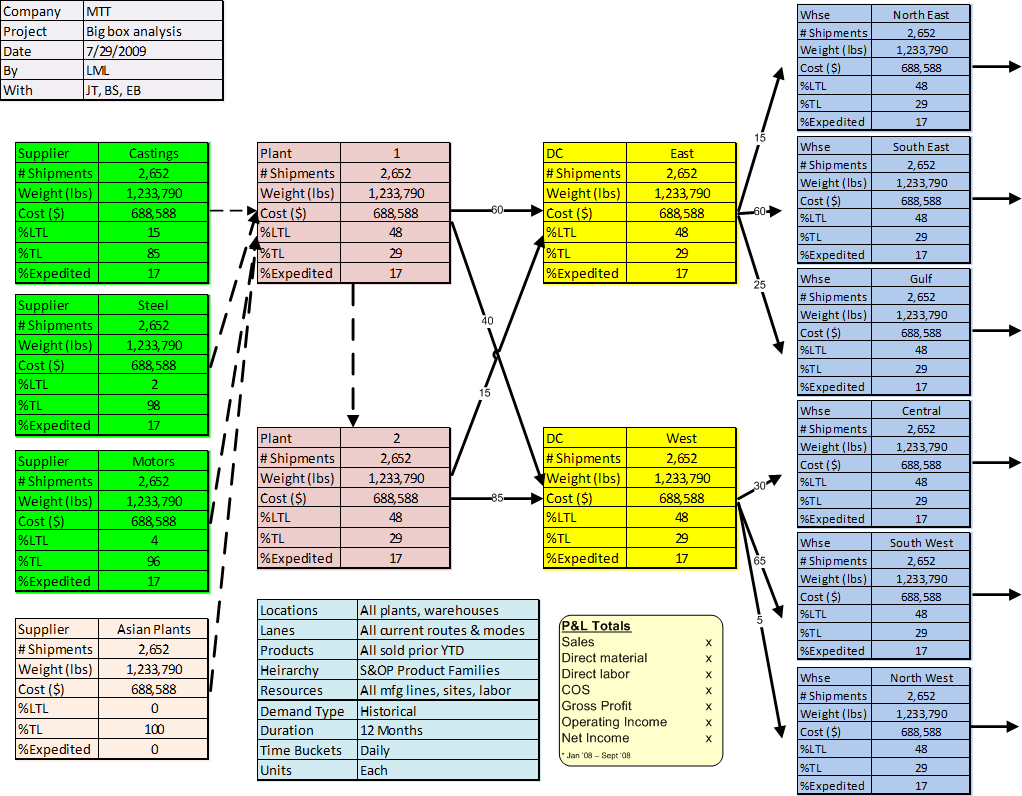
Whenever doing any kind of analysis its tempting to start loading up the tables or spreadsheets and start slicing and dicing only to find out that something is foggy, missing, or corrupted. John Trestrail of Next Wave Agency introduced me to an intermediate step between data collection and building a distribution network computer model, a step he calls Paper Modeling. Paper Models are visual summaries of material flows and key model parameters on a single sheet of paper.
Depending on the scope and nature of the network modeling objectives we create a detailed list of data requirements. Keeping track of the data can be tricky. As we start gathering up the source files we need to validate and verify, checking for formatting, date ranges, duplicate and missing data, units of measure, etc. To do this we’ll summarize, sort, sub total, and graph and then compare our results to other independent quantifiers for a sanity check. For example when looking at the customer address book and customer orders we’ll filter for duplicates, sort and search for missing zip codes, filter out customers with zero sales, then check with Shipping and Accounts Receivables to see how many customers they think we have. Another example is matching shipments to ship-to addresses and not bill-to. The number of ship-to’s should be less than or equal to the number of bill-to’s, right? Total shipments at cost should tie out to Cost Of Goods Sold, and so we cross check our shipment grand totals with Finance.
Starting with the network sites or facilities and our understanding of how the goods flow we build a network schematic, like so …
 With this visualization we can make sure we understand the source and destination of goods moving through the network. In this example Plant 2 is a satellite facility that gets almost all of its raw materials from Plant 1 rather than directly from the suppliers. Changing this arrangement might be a what-if scenario, but for now we are only trying to describe the current state.
The software model will need to have the address, zip code, or longitude and latitude for each of these facilities. We’ll also need to confirm that there are no other facilities in the network, other warehouses folks ‘forgot’ to talk about. We’ll also want to be sure we have all the shipping transactions represented here, especially the transfers between the two plants, something often overlooked in the initial data collection. In Excel we might build a From-To pivot table to sum up all the dollars, pieces, pounds moving between each site. Often we find nontrivial volume of activity outside of the initial standard flows. Are these transactions erroneous, mis-coded, new or old? What’s the story?
Adding all of the end customers to this schematic could make it unnecessarily cluttered. For now we can assume each sales warehouse serves its own ‘region’, but maybe not, so we’ll use the modeling software show us that later.
Now we come to the Paper Model where we add data and summary tables to the flow schematic and to capture total spend, fixed and variable costs, etc. In very complex networks all of the sites may not fit on a single page, even when using A3 or 11×17 size paper. Then it may be necessary to prepare paper models for each of the major activity centers, such as the production facilities and distribution centers. With the paper models complete we now shop them around and get feedback on completeness and reasonableness. First drafts are almost always done by hand and in pencil. Here’s a mock up, sorry can’t show you real data – proprietary non disclosure agreements and all of that…

